
Loading...
Loading...
Loading...
Loading...
Loading...
Loading...
Loading...
Loading...
Loading...
Loading...
Loading...
Loading...
Loading...
Loading...
Loading...
Loading...
Loading...
Loading...
Loading...
Loading...
Loading...
Loading...
Loading...
Loading...
Loading...
2022-NOV-22
ColdBox 7 support
New TimerDelegate that can be used to add timer functions to any model
Timer service rewritten to support nesting and included metadata
Ability to open views and layouts from the execution timers in any Code Editor
New WireBoxCollector which is only used if enabled. This greatly accelerates the performance of the request collector since before they where in the same collector.
Ability to open CFCs that are profiled by the WireBox Collector in any Code Editor.
Ability to open the Handler events that are profiled by the Request Collector in any Code Editor.
New life-cycle events: onDebuggerUnload, onDebuggerLoad
Ability for the custom timeIt() functions to accept metdata to store in the execution timer
New Slowest Queries panel for cborm, acf, and qb/quick
New visualizer total db time as well as request time including percentage of the request time
Ability to export a profiler in json
Ability to sort the visualizer's profilers
Timer service reconstructing the timer hashes and profilers twice.
timeIt() helper was not passing the closure correctly
If doing a fwreinit on the visualizer, the current profiler was still being show even thought it was empty. Add an empty check to avoid the big bang!
Tracers are now streamlined and stored alongside the request profilers
Small UI fixes on request profiler HTTP methods
WireBox collecting is now done by the WireBox collector not the Request Collector.
Adobe 2016 Dropped
Migration to java random id's for speed
A synopsis of the major version history of the project.
In this section, you will find the release notes for each version we release under this major version. If you are looking for the release notes of previous major versions use the version switcher at the top left of this documentation book. Here is a breakdown of our major version releases.
We continue to set the foundations of an HQ service with the addition of ColdBox 7 support, new collectors, performance optimizations, slowest transactions, and much more.
This was a complete rewrite of the module to support standalone capabilities and the foundation of the upcoming CBDebugger HQ.
We migrated the entire UI to leverage AlpineJS and ColdBox Elixir and set the foundation of the new upcoming UI rewrite.
Added SQL support for ORM and Adobe queries with IDE integrations.
A movement to modern engines and a streamlined UI for inclusion in all applications. REST Application support was added alongside ColdBox 6 support.
The initial release.
The ColdBox Debugger module is a lightweight performance monitor and profiling tool for ColdBox applications.
The ColdBox Debugger module is a lightweight performance monitor and profiling tool for ColdBox applications. It can generate a nice debugging panel on every rendered page or a dedicated visualizer to make your ColdBox application development nicer, more funner and greater! Yes, funner is a word!
The ColdBox Debugger tracks your requests, whether Ajax, traditional, or REST, its environment, execution, etc. Here is a listing of some of the capabilities you get with the ColdBox Debugger:
Track all incoming requests to your applications
Track exceptions and execution environment
Track incoming HTTP requests, parameters, body, and much more
Track final request collections
Lucee 5+
ColdFusion 2018+
ColdBox 6+
ColdBox Debugger is maintained under the guidelines as much as possible. Releases will be numbered in the following format:
And constructed with the following guidelines:
Breaking backward compatibility bumps the major (and resets the minor and patch)
New additions without breaking backward compatibility bumps the minor (and resets the patch)
Bug fixes and misc changes bump the patch
Apache 2 License:
Source:
ForgeBox:
Community:
Issues:
This module is professional open-source software backed by offering services like:
Custom Development
Professional Support & Mentoring
Training
Server Tuning
Because of His grace, this project exists. If you don't like this, then don't read it, it's not for you.
"Therefore being justified by faith, we have peace with God through our Lord Jesus Christ: By whom also we have access by faith into this grace wherein we stand, and rejoice in hope of the glory of God." Romans 5:5
Learn more about this book
The source code for this book is hosted on GitHub: . You can freely contribute to it and submit pull requests. Ortus Solutions, Corp copyrights the contents of this book and cannot be altered or reproduced without the author's consent. All content is provided "As-Is" and can be freely distributed.
The majority of code examples in this book are done in cfscript.
The majority of code generation and running of examples are done via CommandBox: The ColdFusion (CFML) CLI, Package Manager, REPL -
Send message tracers to store in the request tracker
The CBDebugger ships with a LogBox appender called the TracerAppender that if enabled it will intercept all log calls into the ColdBox Debugger tracers panel. It will show the log with it's log level and even the complex extra information. The default log levels for the appender are:
min : fatal
max : debug
Profile ColdBox Module registration and activation
Profile any ColdBox Interception Call
In an event-driven framework like ColdBox, there are tons of events that fire within traditional request/response transactions. You can activate our tracker and we will trace and profile interception calls. Activate it via the settings first:
Once activated, you can add a collection of interception points to profile in your application. We will track them for you and even if they are ORM calls we will tell you which entity initiated the call.
Profile object creations via WireBox
There will be cases where you need to test the performance of the creation of certain objects in WireBox. You can do so by activating the profileWireBoxObjectCreation setting in the requestTracker. Once enabled, you will see the profiling of all objects created by WireBox in the debug timers.
Turn the debugger on/off when needed
The debugger can be enabled via URL commands if needed in public facing applications with a combination of two url keys:
debugMode:boolean - Control to turn the debugger on/off
debugPassword:string - The secure password to use to enable the debugger
Please see the on how to add the default debug mode and debug password. If your debug password is validated and you turn on debug mode a secured cookie will be stored for you and you will be able to visualize the debugger. Once you turn it off, then it will remove this cookie for you.
enabled
Boolean
false
Enable the collector
expanded
Boolean
false
Expand the panel by default or not
requestTracker : {
...
profileWireBoxObjectCreation : true
...
}
Please note that you can also add a cbSecurity rule if needed and add further security, which we recommend.
https://myapp.com/cbdebugger?debugmode=true&debugpass=mys3cret3keyTrack Hibernate and cborm queries, criteria queries, and session stats
Track qb and quick queries, entities, and stats
Tap into LogBox via our Tracer messages and discover logging on a per-request basis
Profile execution and results of ANY model object
Profile execution of ANY ColdBox interception point
Custom Timer helpers for adding timing methods and annotations anywhere in your code
Profile your production or development apps with ease
Track ColdBox modules and lifecycles
Track Hyper HTTP/S calls
Track Adobe ColdFusion Queries (ColdFusion 2018+)
Track Lucee Queries
Security Hardening
Code Reviews


Flash, Flex, ColdFusion, and Adobe are registered trademarks and copyrights of Adobe Systems, Inc.
The information in this book is distributed “as is” without warranty. The author and Ortus Solutions, Corp shall not have any liability to any person or entity concerning loss or damage caused or alleged to be caused directly or indirectly by the content of this training book, software, and resources described in it.
We highly encourage contributions to this book and our open-source software. The source code for this book can be found in our GitHub repository where you can submit pull requests.
10% of the proceeds of this book will go to charity to support orphaned kids in El Salvador - https://www.harvesting.org/. So please donate and purchase the printed version of this book; every book sold can help a child for almost 2 months.
Shalom Children’s Home is one of the ministries that are dear to our hearts located in El Salvador. During the 12-year civil war that ended in 1990, many children were left orphaned or abandoned by parents who fled El Salvador. The Benners saw the need to help these children and received 13 children in 1982. Little by little, more children came on their own, churches and the government brought children to them for care, and the Shalom Children’s Home was founded.
Shalom now cares for over 80 children in El Salvador, from newborns to 18 years old. They receive shelter, clothing, food, medical care, education, and life skills training in a Christian environment. The home is supported by a child sponsorship program.
We have personally supported Shalom for over 6 years now; it is a place of blessing for many children in El Salvador who either have no families or have been abandoned. This is a good earth to seed and plant.
enabled
Boolean
false
Enable the collector
expanded
Boolean
false
Expand the panel by default or not
tracers : { enabled : true, expanded : false },enabled
Boolean
false
Enable the collector
expanded
Boolean
false
Expand the panel by default or not
modules : { enabled : false, expanded : false }// Profile Custom or Core interception points
profileInterceptions : true,
// By default all interception events are excluded, you must include what you
// want to profile
includedInterceptions : [ "onUserSave", "ORMPostLoad" ],Profile all calls made by Hyper as http/s
You can use the hyper configuration structure to configure the hyper panel in the debugger. This will track all outgoing http/s calls made by the Hyper module in your debugger.
Luis Majano is a Computer Engineer that has been developing and designing software systems since the year 2000. He was born in San Salvador, El Salvador in the late 70’s, during a period of economical instability and civil war. He lived in El Salvador until 1995 and then moved to Miami, Florida where he completed his Bachelors of Science in Computer Engineering at Florida International University. Luis resides in Houston, Texas with his beautiful wife Veronica, baby girl Alexia and baby boy Lucas!
He is the CEO of Ortus Solutions, a consulting firm specializing in web development, ColdFusion (CFML), Java development and all open source professional services under the ColdBox and ContentBox stack. He is the creator of ColdBox, ContentBox, WireBox, MockBox, LogBox and anything “BOX”, and contributes to many open source ColdFusion/Java projects. You can read his blog at
Luis has a passion for Jesus, tennis, golf, volleyball and anything electronic. Random Author Facts:
He played volleyball in the Salvadorean National Team at the tender age of 17
The Lord of the Rings and The Hobbit is something he reads every 5 years. (Geek!)
His first ever computer was a Texas Instrument TI-86 that his parents gave him in 1986. After some time digesting his very first BASIC book, he had written his own tic-tac-toe game at the age of 9. (Extra geek!)
Keep Jesus number one in your life and in your heart. I did and it changed my life from desolation, defeat and failure to an abundant life full of love, thankfulness, joy and overwhelming peace. As this world breathes failure and fear upon any life, Jesus brings power, love and a sound mind to everybody!
“Trust in the LORD with all your heart, and do not lean on your own understanding.” Proverbs 3:5
Profile any object method call
The ColdBox debugger allows you to profile the execution of ANY method in ANY CFC via our AOP pointcuts. All you need to do is add the profile annotation to a method or component declaration in your model/ORM objects. Once you do, the debugger will track the execution of those methods in the debug timers panel for you. First thing to do is make sure the setting is turned on:
requestTracker : {
// Profile model objects annotated with the `profile` annotation
profileObjects : true,
// If enabled, will trace the results of any methods that are being profiled
traceObjectResults : false,
}The traceObjectResults if true will track the actual results of the method calls into your debugger timer panel. Careful, as we will serialize anything you send to us. Then add the profile annotation to any method or CFC.
/**
* Profile all methods in this component
*/
component profile{
}
// Add the profile to this method to track it
function saveAllObjects() profile{
}Profiling objects is great because you can just annotate and forget. Nothing to turn off in production. However, just note that doing AOP abstractions on more methods, the more slow downs you will experience, especially on transient objects. We would recommend that you use it on specific methods only and be very wearisome of using the tracing of object results.
Profile any Lucee SQL query
The luceeSql collector can be activated if you are in a Lucee engine and it will track all SQL calls made by your application. You can event choose to show the biding parameters or not.
// Lucee SQL Collector
luceeSql : { enabled : false, expanded : false, logParams : true }Profile all cborm queries
January 2024
CBDebugger 4.2 comes action-packed with tons of new features, improvements and bug fixes. Let's check out the major areas of improvement.
You can now track Hyper http/s requests right in a new panel. It will also aggregate the request's total time, slowest, grouped, and timeline. It also comes with some great options for configuration:
<major>.<minor>.<patch>enabled
Boolean
false
Enable the collector
expanded
Boolean
false
Expand the panel by default or not
logParams
Boolean
true
Log the binding query parameters

enabled
Boolean
false
Enable the collector
expanded
Boolean
false
Expand the panel by default or not
logParams
Boolean
true
Log the binding query parameters

enabled
Boolean
false
Enable the collector
expanded
Boolean
false
Expand the panel by default or not
logParams
Boolean
true
Log the binding query parameters


false
Log the response from the API Call
logRequestBody
Boolean
false
Logs the request body
enabled
Boolean
false
Enable the collector
expanded
Boolean
false
Expand the panel by default or not
logResponseData

Boolean
enabled
Boolean
false
Enable the collector
expanded
Boolean
false
Expand the panel by default or not
logParams
Boolean
true
Log the binding query parameters
// Adobe ColdFusion SQL Collector
acfSql : { enabled : false, expanded : false, logParams : true }// Hyper Collector
hyper : {
enabled : false,
expanded : false,
logResponseData : false,
logRequestBody : false
}He has of late (during old age) become a fan of organic gardening.
The ColdBox debugger can now profile any SQL running via Lucee queries. It will provide grouped, timeline, and slowest views as well. However, you must make sure that Lucee is in debugging mode.
IMPORTANT Please note that to use this feature the engine must have two debugging settings enabled
You can easily add those to your .cfconfig.json or enable it under the Debugging panel in the Lucee Admin.
Here are the configuration settings available for it:
You now can generate Java heap dumps from the debugger visualizer so you can analyze the heap offline. Great for debugging memory leaks or just system stability.
The request dock has now been cleaned up to only show the request's information and the UI updated for a better and seamless dock UI. The rest of the information has been moved to the visualizer at the /cbdebugger entry point.
Once you click on the dock, it will expand to show the current request's debugging information.
We have added new improvements to visualizing SQL and JSON in the context panels.
You can now add timers manually into the tracking facilities via the Timer object's add() method or via the TimerDelegate and the addCBTimer() method.
You can get access to the Timer object in different ways:
New HyperCollector so you can now track hyper requests if enabled
Timer can now add timers a-la-carte via the add() method
TimerDelegate now has a addCBTimer() method
New fast and furious and tiny SQL/JSON Formatter
New LuceeSqlCollector you can use to profile all SQL calls in Lucee
New luceeSql configuration to control the Lucee SQL calls collector
Changed the instance argument to any in the debuggerService.openInEditorURL to allow for a flat representational string of the URL to open in the editor.
Ability to download a heap dump snapshot from the visualizer
The request panel dock is now a real dock and the only one presented, the rest are only show in the visualizer
The requestTracker.expanded option is now removed, it's always expanded for visualizer and contracted for the dock
Updated test harness UI to make it easier to create debugging events
Dumb whitespace added by CFML engines when doing inline <pre>#method()#</pre> calls.
Better error handling when Debugger assets are not compiled instead of a cryptic error message: The parameter [str] to function [closure_m] is required but was not passed in.


Profile the request collections in ColdBox
You can use the collections configuration structure to configure the collections panel in the debugger. This will dump out the rc and the prc collections with the final snapshot of their data. We recommend that you only enable this collector with the appropriate dump top levels as it can completely crash your server trying to dump out all the variables in the collections.
WARNING : This collector can crash your server. Make sure you have limits and use it wisely.
// Request Collections Reporting
collections : {
// Enable tracking
enabled : false,
// Expanded panel or not
expanded : false,
// How many rows to dump for object collections
maxQueryRows : 50,
// How many levels to output on dumps for objects
maxDumpTop : 5
}// Hyper Collector
hyper : {
enabled : false,
expanded : false,
logResponseData : false,
logRequestBody : false
}"debuggingDBEnabled":"true",
"debuggingEnabled":"true",luceeSql : {
enabled : true,
expanded : false,
logParams : true
},/**
* Add a timer to the stack manually. You will need the label,
* executionTime and stoppedAt timestamps
*
* @label The label to use as a timer label
* @executionTime The execution time in ms to register
* @startedAt The date time the timer was started
* @stoppedAt The date time the timer was stopped
* @metadata A struct of metadata to store in the execution timer
* @parent An optional parent label
* @type The type of execution timed: request, view-render, layout-render, event, renderer
*/
function add(
required label,
required executionTime,
startedAt = now(),
stoppedat = now(),
struct metadata = {},
parent = "",
type = "timer"
)// Get in your layouts/handlers/views/interceptors
getInstance( "Timer@cbDebugger" )
// Inject
property name="timer" inject="Timer@cbdebugger"
// ColdBox 7 Delegates
component delegates="TimerDelegate@cbdebugger"{}


Number of rows to show for query dumps
maxDumpTop
Integer
5
How many levels to output on object dumps
enabled
Boolean
false
Enable the collector
expanded
Boolean
false
Expand the panel by default or not
maxQueryRows
Integer

50

Debugger Request Tracker
Apart from debugging the incoming request and presenting the debugger at the end of the request (Request Dock Panel), you can also navigate to /cbdebugger and visualize the Debugger request tracker. This panel will monitor ALL incoming requests to your application: REST, SOAP, Ajax, etc.
You can execute several commands from this visualizer:
Clear all request history
Reinit ColdBox
Shutdown the debugger visualizer
Refresh the requests
Auto-refresh the requests
Produce a Java Heap Dump
Each request is also tracked and visualized according to its activated collectors.
You can use the requestTracker.storage setting to configure where the request trackers are stored. The default values are:
memory : The default, which stores the trackers in memory
cachebox : Store the request trackers in a CacheBox provider via the cacheName
cacheName
The debugger comes pre-configured to store a stack of 50 requests in memory. You can change this via the following setting:
If you wanted to profile even the debugger itself you can use the trackDebuggerEvents flag if needed.
The debugger can paint requests in a different color if they are executing slower than the threshold setting shown below. Please note that the threshold is in milliseconds.
Each request tracker has a panel called ExecutionTimers which shows all the timers the debugger was able to track during that request. You can configure it via the following settings:
The expanded is just a simple boolen to control if the panel is open by default, which it is. The slowTimerThreshold is in milliseconds and when a timer passes that threshold it will be painted red; like the screenshot above.
You can control if the ColdBox information panel is open or closed by default via the coldboxInfo setting:
You can also configure the HTTP Request panel to do your bidding:
You can have the panel open or closed and even chose if the HTTP Body request will be stored or not.
Be careful to not go overboard with profiling the HTTP Body because it can be very large.
All requests that produce exceptions are also tracked and special exception collectors are activated automatically to store the produced exception:
It will store the stack trace and the tag context of the exception so you can visualize it and fix your bug. It will also have links to open the offending code in VSCode or your favorite editor right from the debugger. You can even open and navigate the tag context in your IDE from the debugger.
You can also see all the collectors and their information to the point of the exception:
CBDebugger emits several interception events
The debugger can be extended by listening to several events it fires. Here is a collection of such events and the data they emit.
beforeDebuggerPanel
Before the debugger panel is rendered
afterDebuggerPanel
After the last debugger panel is rendered
beforeProfilerReportPanels
Before any individual profiler report panels are rendered
No event data emitted
This event is fired once the debugger is ready to start tracking the request. You can use the structure to incorporate anything into it.
This event is fired right before the request tracker struct is stored in permanent storage. Your last chance to add data into the tracker structure.
templateafterProfilerReportPanels
After any individual profiler report panels are rendered
onDebuggerLoad
Fires after the module has fully loaded and been configured with all runtime settings
onDebuggerUnload
Fires after the module is unloaded
onDebuggerRequestTrackerCreation
When the request tracker has been created and placed in request scope
onDebuggerProfilerRecording
Before the request tracker is saved in the profiler, last chance to influence the recording
debuggerConfig
The debugger configuration struct
debuggerService
The debugger service object
debuggerConfig
The debugger configuration struct
debuggerService
The debugger service object
profiler
The full profiler report structure
requestTracker
The request tracker structure you can use to add your own data collection for the request.
requestTracker
The request tracker structure you can use to add your own data collection for the request.
// Store the request profilers in heap memory or in cachebox, default is memory
storage : "memory",
// Which cache region to store the profilers in
cacheName : "template",// How many tracking profilers to keep in stack
maxProfilers : 50,// Track all cbdebugger events, by default this is off, turn on, when actually profiling yourself :) How Meta!
trackDebuggerEvents : false,// Slow request threshold in milliseconds, if execution time is above it, we mark those transactions as red
slowExecutionThreshold : 1000,// Control the execution timers
executionTimers : {
expanded : true,
// Slow transaction timers in milliseconds, if execution time of the timer is above it, we mark it
slowTimerThreshold : 250
},coldboxInfo : {
expanded : false
}// Control the http request reporting
httpRequest : {
expanded : false,
// If enabled, we will profile HTTP Body content, disabled by default as it contains lots of data
profileHTTPBody : false
}


Leverage CommandBox to install into your ColdBox app:
You will now have to configure the debugger for it to start tracking your application. This will activate the debugger in your application and render out at the end of a request as a dock or by visiting the debugger request tracker visualizer at /cbdebugger.
Once the module is activated, the following model objects will be available for you:
debuggerService@cbdebugger - The main debugger service
JVMUtil@cbdebugger - Useful for creating thread dumps and heap dumps
timer@cbdebugger - Useful to time operations
We ship the following delegates:
TimerDelegate@cbdebugger
You can use it to add timing capabilities to any CFC:
The available methods for delegation are:
We also add several helpers to all interceptors, layouts, views, and handlers:
Hibernate extension (on Lucee)
orm package on ACF 2021+
cbdebugger package on ACF 2021+
Check Database Activity on the debugger page or cfconfig setting
Enable debug logging and database activity in the Lucee Debugging screens or via cfconfig:
box install cbdebugger --savedev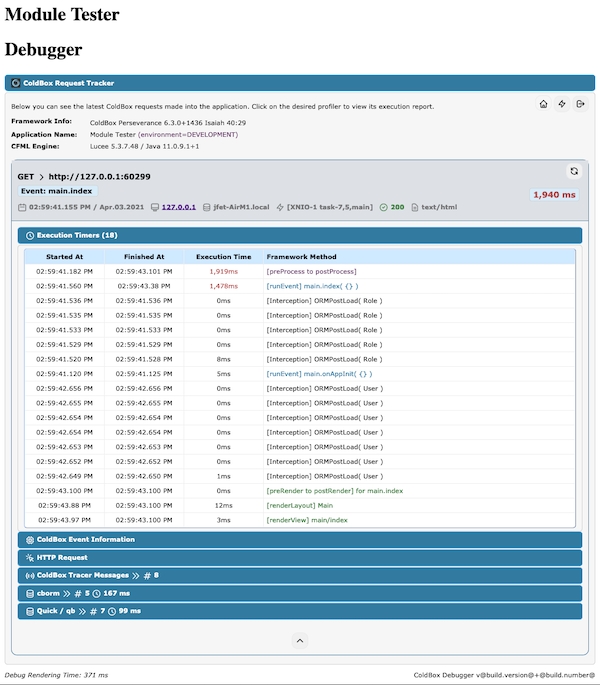
enabled
Boolean
false
Enable the collector
expanded
Boolean
false
Expand the panel by default or not
cachebox : { enabled : false, expanded : false }
component delegates="TimerDelegate@cbdebugger"{
...
cbTimeIt( "processData", ()=> {
... code to time
}
}/**
* Start a timer with a tracking label
*
* @label The tracking label to register
*
* @return A unique tracking hash you must use to stop the timer
*/
function startCBTimer( required label )
/**
* End a code timer with a tracking hash. If the tracking hash is not tracked, we ignore it
*
* @labelHash The timer label hash to stop
*/
function stopCBTimer( required labelHash )
/**
* Time for the execution of the passed closure that we will execute for you
*
* @label The label to use as a timer label
* @closure The target to execute and time
* @metadata A struct of metadata to store in the execution timer
*/
function cbTimeIt(
required label,
required closure,
struct metadata = {}
)
/**
* Add a timer to the stack manually. You will need the label, executionTime and stoppedAt timestamps
*
* @label The label to use as a timer label
* @executionTime The execution time in ms to register
* @startedAt The date time the timer was started
* @stoppedAt The date time the timer was stopped
* @metadata A struct of metadata to store in the execution timer
* @parent An optional parent label
* @type The type of execution timed: request, view-render, layout-render, event, renderer
*/
function addCBTimer(
required label,
required executionTime,
startedAt = now(),
stoppedat = now(),
struct metadata = {},
parent = "",
type = "timer"
)/**
* Method to turn on the rendering of the debug panel on a request
*/
any function showDebugger()
/**
* Method to turn off the rendering of the debug panel on a request
*/
any function hideDebugger()
/**
* See if the debugger will be rendering or not
*/
boolean function isDebuggerRendering()
/**
* Start a timer with a tracking label
*
* @label The tracking label to register
*
* @return A unique tracking hash you must use to stop the timer
*/
function startCBTimer( required label )
/**
* End a code timer with a tracking hash. If the tracking hash is not tracked, we ignore it
*
* @labelHash The timer label hash to stop
*/
function stopCBTimer( required labelHash )
/**
* Time for the execution of the passed closure that we will execute for you
*
* @label The label to use as a timer label
* @closure The target to execute and time
* @metadata A struct of metadata to store in the execution timer
*/
function cbTimeIt( required label, required closure, struct metadata = {} )
/**
* Shortcut to get a reference to the ColdBox Debugger Service
*/
function getCBDebugger()
/**
* Push a new tracer into the debugger. This comes from LogBox, so we follow
* the same patterns
*
* @message The message to trace
* @severity The severity of the message
* @category The tracking category the message came from
* @timestamp The timestamp of the message
* @extraInfo Extra info to store in the tracer
*/
DebuggerService function cbTracer(
required message,
severity = "info",
category = "",
timestamp = now(),
extraInfo = ""
)debuggingShowDatabase : true"debuggingDBEnabled":"true"
"debuggingEnabled":"true"
The debugger is highly configurable, and we have many settings to assist you in your development adventures and performance tuning. The debugger works by activating data collectors and configuring them. Please note that the more collectors you activate, the slower your application can become. By default, we have pre-selected defaults, which add negligible performance to your applications.
The ColdBox Debugger collectors are powerful listeners used for debugging and analyzing applications built on ColdBox. These collectors gather various types of information and statistics during the execution of an application, allowing developers to gain insights into the application's behavior and performance.
The collectors are designed to capture data related to different aspects of an application, such as request information, execution times, database queries, cache usage, and log messages. Please note that each collector can have its own configuration options.
If you are in ColdBox 6, add the following configuration settings to the moduleSettings structure in your config/Coldbox.cfc or if you are in ColdBox 7+ you can create a config/modules/cbdebugger.cfc and add your configuration. Here is the default configuration CBDebugger ships with:
You can enable or disable the request tracking globally via the enabled master switch, make sure to set debugPassword
The in production environments and enabled via our URL password actions. This allows you to profile your application and then turn on the debugger just for YOU via our debugging cookies.
Please note that you can also add a cbSecurity rule if needed and add further security, which we recommend.
In development environments where no password is needed use the follwing setting debugPassword : "", cb:null will generate a random password.
If you can't access the debugger pannel, you might need to add debugmode=1 to your request
You can enable/disable the rendering of our request panel dock which shows the profiling of the request.
Tracks the rc and prc collections in the debugger.
Tracks all Hyper API calls
Tracks all SQL calls made by Lucee
Monitors module registration and activations
Tracks all SQL calls made via qb
Tracks incoming ColdBox requests
Enables tracer messages in a request profile
Tracks all SQL calls made by Adobe
Tracks ColdBox executors and tasks
Monitors and tracks Cache Providers
Tracks all SQL calls made via cborm criteria queries or helpers
{
// This flag enables/disables the tracking of request data to our storage facilities
// To disable all tracking, turn this master key off
enabled : true,
// This setting controls if you will activate the debugger for visualizations ONLY
// The debugger will still track requests even in non debug mode.
debugMode : controller.getSetting( name = "environment", defaultValue = "production" ) == "development",
// The URL password to use to activate it on demand
debugPassword : "cb:null",
// This flag enables/disables the end of request debugger panel docked to the bottem of the page.
// If you disable i, then the only way to visualize the debugger is via the `/cbdebugger` endpoint
requestPanelDock : true,
// Request Tracker Options
requestTracker : {
// Store the request profilers in heap memory or in cachebox, default is memory
storage : "memory",
// Which cache region to store the profilers in
cacheName : "template",
// Track all cbdebugger events, by default this is off, turn on, when actually profiling yourself :) How Meta!
trackDebuggerEvents : false,
// Expand by default the tracker panel or not
expanded : false,
// Slow request threshold in milliseconds, if execution time is above it, we mark those transactions as red
slowExecutionThreshold : 1000,
// How many tracking profilers to keep in stack
maxProfilers : 50,
// If enabled, the debugger will monitor the creation time of CFC objects via WireBox
profileWireBoxObjectCreation : false,
// Profile model objects annotated with the `profile` annotation
profileObjects : false,
// If enabled, will trace the results of any methods that are being profiled
traceObjectResults : false,
// Profile Custom or Core interception points
profileInterceptions : false,
// By default all interception events are excluded, you must include what you want to profile
includedInterceptions : [],
// Control the execution timers
executionTimers : {
expanded : true,
// Slow transaction timers in milliseconds, if execution time of the timer is above it, we mark it
slowTimerThreshold : 250
},
// Control the coldbox info reporting
coldboxInfo : { expanded : false },
// Control the http request reporting
httpRequest : {
expanded : false,
// If enabled, we will profile HTTP Body content, disabled by default as it contains lots of data
profileHTTPBody : false
}
},
// ColdBox Tracer Appender Messages
tracers : { enabled : true, expanded : false },
// Request Collections Reporting
collections : {
// Enable tracking
enabled : false,
// Expanded panel or not
expanded : false,
// How many rows to dump for object collections
maxQueryRows : 50,
// How many levels to output on dumps for objects
maxDumpTop : 5
},
// CacheBox Reporting
cachebox : { enabled : false, expanded : false },
// Modules Reporting
modules : { enabled : false, expanded : false },
// Quick and QB Reporting
qb : {
enabled : false,
expanded : false,
// Log the binding parameters
logParams : true
},
// cborm Reporting
cborm : {
enabled : false,
expanded : false,
// Log the binding parameters
logParams : true
},
// Adobe ColdFusion SQL Collector
acfSql : { enabled : false, expanded : false, logParams : true },
// Lucee SQL Collector
luceeSQL : { enabled : false, expanded : false, logParams : true },
// Async Manager Reporting
async    : { enabled : true, expanded : false }
};enabled : false// This setting controls if you will activate the debugger for visualizations ONLY
// The debugger will still track requests even in non debug mode.
debugMode : controller.getSetting( name = "environment", defaultValue = "production" ) == "development",
// The URL password to use to activate it on demand
debugPassword : "cb:null"// This flag enables/disables the end of request debugger panel docked to the bottem of the page.
// If you disable it, then the only way to visualize the debugger is via the `/cbdebugger` endpoint
requestPanelDock : true